Observability can sometimes feel like a buzzword, but either a buzzword or not, it is a very important subject when we talk about software, more important distributed systems.
What is observability
But what is the definition of Observability? The book Observability Engineering defines it as:
“Put simply, our definition of “observability” for software systems is a measure of how well you can understand and explain any state your system can get into, no matter how novel or bizarre.”
Another definition that I like is present in the book Distributed Tracing in Practice:
“Engineers at organizations like Google and Twitter originally promoted observability as a method not just for monitoring their production systems but for being able to understand the behavior of those systems using a relatively small number of signals.”
And OpenTelemetry defines it as:
‘Observability lets us understand a system from the outside, by letting us ask questions about that system without knowing its inner workings. Furthermore, allows us to easily troubleshoot and handle novel problems (i.e. “unknown unknowns”), and helps us answer the question, “Why is this happening?”’
What these definitions have in common is that an observable system is one in which we can understand the current state of the system and it is behavior by looking at some signals (which we are going to talk about later). Here the keyword is to understand. Another point that both books above make is we should not need seasonal software engineers that are in a company for a long time to understand the system. A new developer with curiosity and access to the tools should be able to understand it.
For us to make an observable system, it must emit signals (telemetry) during the code execution, so we can use these signals to construct a view of the current state of the system.
Signals for observability
An observable system emits telemetry, signals about it is behavior. These signals are usually in the form of Logs, Metrics, and Traces.
Logs
Logs are the eldest and most common, it is basically a message with a timestamp.
I, [2021-02-23T13:26:23.505892 #22473] INFO -- : [6459ffe1-ea53-4044-aaa3-bf902868f730] Started GET "/" for ::1 at 2021-02-23 13:26:23 -0800
More advanced uses of logs are structured logs, like JSON with keys and values, where you can have not only a message but multiple fields.
{"@timestamp":"2023-01-21T13:24:26.130Z","@version":"1","message":"could not retrieve default encryption key","logger_name":"com.sample.Logger","thread_name":"scheduled-task-4","level":"WARN","level_value":30000,"app_name":"service-name","pid":"1","name":"log","trace":{"traceId":"f1fa37d4caf3eb03","spanId":"70f609dc209e8e61","trace_id":"f1fa37d4caf3eb03","parent_id":"70f609dc209e8e61"}}
Despite structured logs being a lot better, they still lack a lot of contextual information, for example where we called from, etc. Logs become more powerful when they have associated Spans, which we will take a look at later.
Metrics
Metrics are another type of signal, according to OpenTelemetry, “Metrics are aggregations over a period of time of numeric data about your infrastructure or application. Examples include system error rate, CPU utilization, and request rate for a given service.”
Knowing for example the memory utilization of a service, for example, can help us understand if the system is in a degraded state.
Spans
A Span represents a unit of work or operation. It usually has a name, timestamp (time started), and also duration. It can (and should) have many other key/value attributes, usually called dimensions. You should add here any dimension that can help you understand better a state or problems in the system.
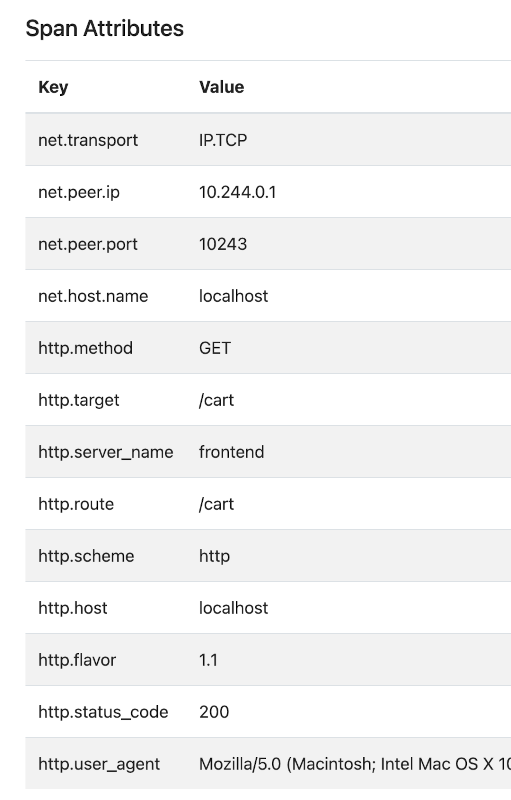
Span example from OpenTelemetry
Traces
Traces, also known as Distributed Traces, are made of one or more spans. They track the entire operation (an HTTP request for example) through multiple services or applications. The main goal is to break down what happens within a request as it flows through a distributed system and with that make the whole debugging and understanding of the system easier.
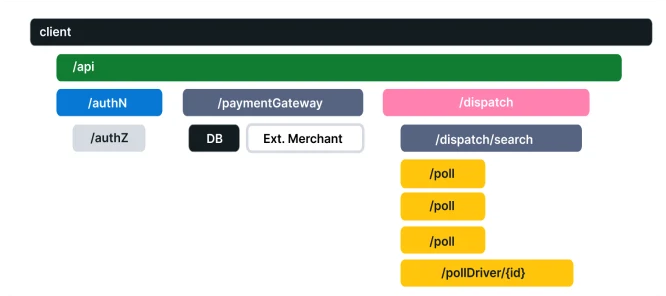
Distribute Tracing example from OpenTelemetry
Traces are essential for a distributed system, as it has all the context and tracks the entire flow of a request through the system.
All these three “pillars” together make your system more observable and help you better debug the harder unknown unknowns.
How to start
Implementation of how to do this for your system will vary greatly based on the language, framework, etc. If you use a framework like Spring, you can use Spring Sleuth which helps you to transfer the context between microservices and also comes with some traces out of the box.
You can also use the OpenTelemetry libraries and SDKs. At the current moment, I haven’t tried any other specific libraries, as I personally have only worked with Spring Sleuth and Zipkin.
I will share more as I learn along.
Happy coding!