We are smart engineers and sometimes when we face a fault in the system, we may tend to think the root cause of the problem is very complex, and that assumption guides our investigations when trying to find the root cause.
We tend to think this way because we know that we are leading with complex systems that can cause complex problems. But, most of the time, the root causes are actually a lot simpler and (maybe stupider) than we think they are.
I am going to share two anecdotes that illustrate this in practice. Both are real-world situations faced by me while debugging issues and trying to find the root causes at work.
Did the Java version, Kotlin version (or both) break my service?
The first example was a service whose basic task was to copy some files over SFTP.
The function was relatively simple. Fetch a list of configurations, for each configuration it should connect to an SFTP server, copy the files from the server over to a temporary folder in the local disk, filter out the files the ones already successfully processed (by querying a DB), and after that upload the unprocessed ones one by one to an S3 bucket. The final step was to download it from SFTP and decrypt the file and further process it.
That was the expected behavior, but what was happening was that we saw some files being uploaded twice to S3, and when that happened, the first one that was downloaded for decryption failed to be decrypted most of the time.
Our first assumption was that we were reading incomplete files from SFTP. But why the second time it worked? Also, we checked the size of the file and it was the same.
And then we checked the time the decryption error started happening. It correlated to a change in the Kotlin version and Java version. The code block that was running twice was inside a new thread, so we started to think it could be something with the new version of Java, Kotlin, or both together. See, here is where we start thinking that the problem is very complex.
After running the service locally, we saw that it didn’t happen. So why was it?
After a few other assumptions and tests, we decided to list all the production configurations in which the service iterates to download the files.
And voilá, it turned out that we had two configurations with the same name, and due to that, it was downloading the same files twice. At the end of the day, the system was working as expected but the problem was in the configuration.
So in summary, we sometimes look for a complex solution or a complex problem, but in the end, it is maybe just a simple configuration error, and the system is working as expected (from the point of view of the service, not the user).
Do we have a memory leak?
In another situation (in another service) we started seeing a service with the following memory (RAM) profile. It was a Java service.
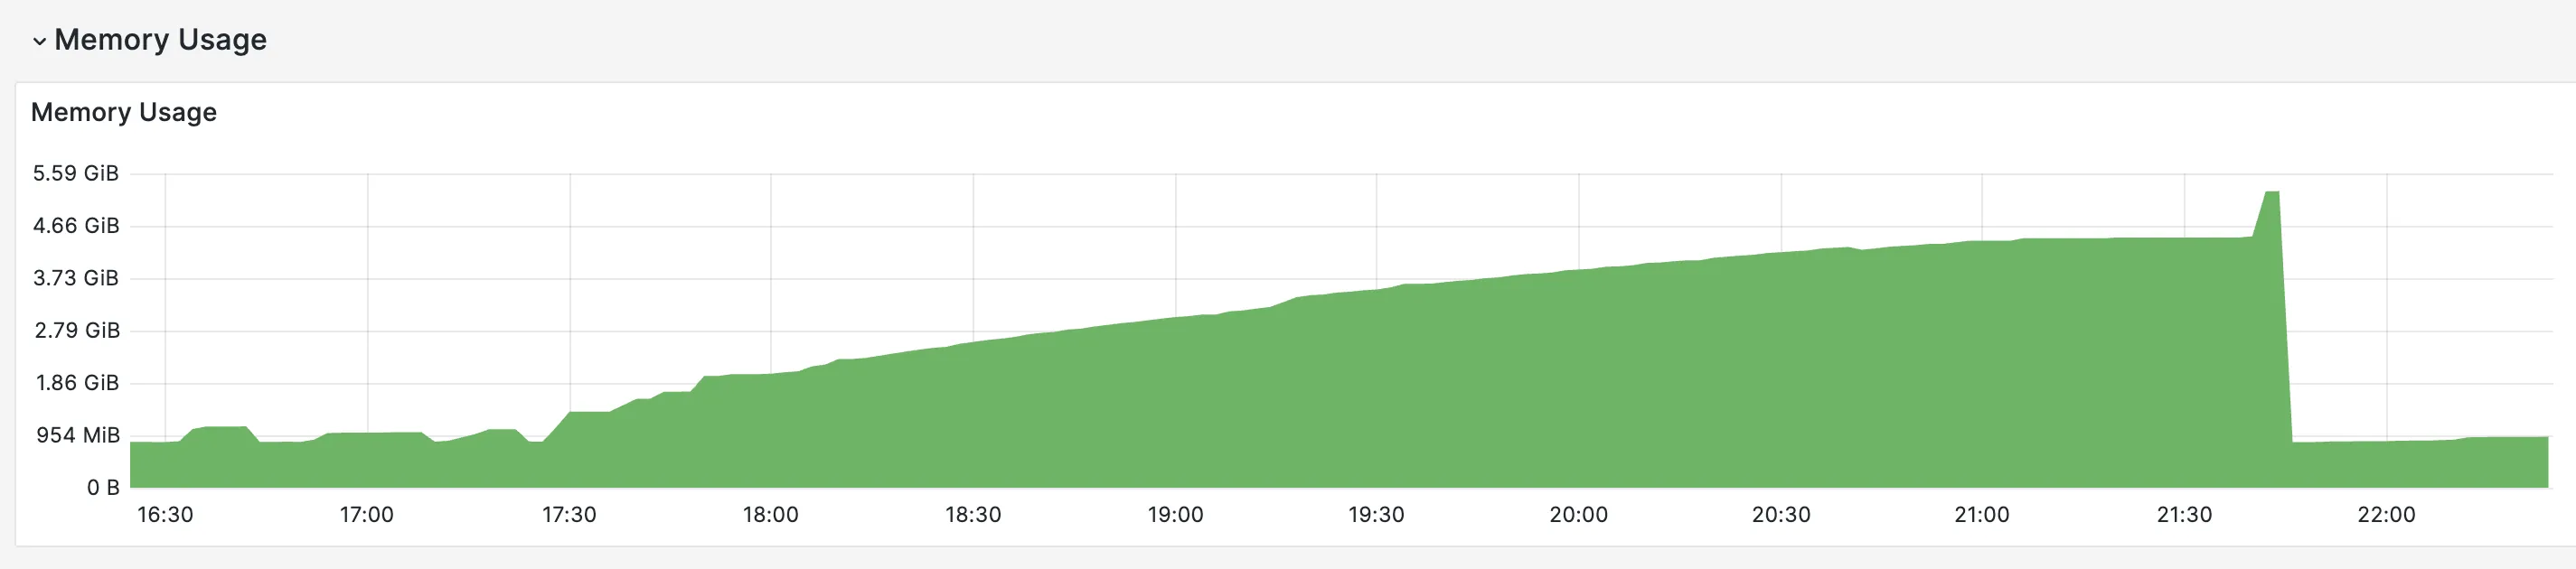
Memory profile of the service
So, you can see that the memory is constantly increasing until it gets to a point where it reaches the maximum, and the service is killed by Kubernetes.
Upon seeing this, the first question was: Do we have a load that would justify this increase? The answer was no.
With no apparent extra load on the service, and no new version released, what could be happening? For sure memory leak in the JVM crossed my mind, and actually was guiding the investigation.
But, by luck, we related it to processing a file but the file itself had nothing very apparent that could cause the problem, was just a file, similar to others that we have been processing successfully.
Still thinking it could be a memory leak, we started processing the file and watched while the memory continued growing, and right before it reached its maximum, we took a thread dump.
The memory dump clearly pointed out a collection, which was really huge, with almost all the service’s memory.
The first look at the code, we could see that there was no way that the collection would be this big, it could have hundreds of records, but not hundreds of thousands.
So what was it, was the GC not cleaning the reference? What are you doing JAVA????
But, looking more closely at the code, there’s a missing condition in the loop, in which depending on the file content, it would fall, and guess what? Never leave.
Basically, in a few rare cases, the code would become an infinite loop and start accumulating the same items in the list until there was no more memory left for the pod and it would be killed.
So, poor GC was not to blame, but one line change was missed by the developer.
I try to keep this in mind when I am looking for root causes of problems. Sometimes the root cause of the problems is simpler than they appear.
Photo by Nubelson Fernandes on Unsplash